About this Install Guide
| Reading time: | 15 min |
| Last updated: | 4 May 2026 |
| Reading time: |
| 15 min |
| Last updated: |
| 4 May 2026 |
This guide shows you how to install and use the tool with the most common configuration. For advanced options and complete reference information, see the official documentation. Some install guides also include optional next steps to help you explore related workflows or integrations.
APerf is an open source command line tool maintained by AWS. It helps you monitor and debug performance on Linux systems by collecting a wide range of performance-related system metrics and data that traditionally require multiple tools, such as perf, sysstat, and sysctl.
APerf collects system data and saves it in an archive. It then generates a static HTML report from one or more archives to visualize the data. When you generate the report, APerf analyzes the data to automatically detect potential performance issues. You can open the report in a browser to view all collected data and analytical findings.
In this guide, you’ll learn how to install APerf on Arm Linux and get started with reports.
Before you begin
Confirm you are using an Arm machine by running:
uname -m
The output should be:
aarch64
To allow APerf to collect Processor Monitoring Unit (PMU) metrics without sudo or root permissions, set /proc/sys/kernel/perf_event_paranoid to -1:
sudo sysctl -w kernel.perf_event_paranoid=-1
To use APerf’s CPU profiling option (--profile), install the perf binary. For more information, see the
Perf for Linux on Arm
install guide.
For kernel address visibility, set /proc/sys/kernel/kptr_restrict to 0:
sudo sysctl -w kernel.kptr_restrict=0
To use APerf’s Java profiling option (--profile-java), install the
async-profiler
tool.
Download and install APerf
You can install APerf by downloading a release from GitHub and extracting it.
The following commands use APerf version 1.2.2. The same commands work with other versions. Replace the file used in these steps with the file for your version of choice. To find the latest version, see APerf releases .
You can download a release from the command line:
wget https://github.com/aws/aperf/releases/download/v1.2.2/aperf-v1.2.2-aarch64.tar.gz
Extract the release:
tar xvfz aperf-v1.2.2-aarch64.tar.gz
Add the path to aperf in your .bashrc file.
echo 'export PATH="$PATH:$HOME/aperf-v1.2.2-aarch64"' >> ~/.bashrc
source ~/.bashrc
Alternatively, you can copy the aperf executable to a directory already in your search path.
sudo cp aperf-v1.2.2-aarch64/aperf /usr/local/bin
Confirm aperf is installed by printing the version:
aperf --version
The output should be:
aperf 1.2.2 (4cf8d28)
Verify APerf is working
To confirm APerf is working, start a collection run with the default settings. The default interval is 1 second, and the default period is 10 seconds.
To start data collection, run:
aperf record -r test_1
After 10 seconds, the collection completes. APerf creates a directory named test_1 and a tar file named test_1.tar.gz.
If you need CPU profiling, add the --profile flag. For Java profiling, add the --profile-java flag.
Create and view a report
Generate a report from the recorded data:
aperf report -r test_1 -n test_report
APerf creates a directory named test_report and a tar file named test_report.tar.gz. The tar file is useful when you want to copy the report to another machine.
To view the report, open the index.html file in the test_report/ directory using a web browser. Press Ctrl+O on Linux and Windows, or ⌘+O on macOS.
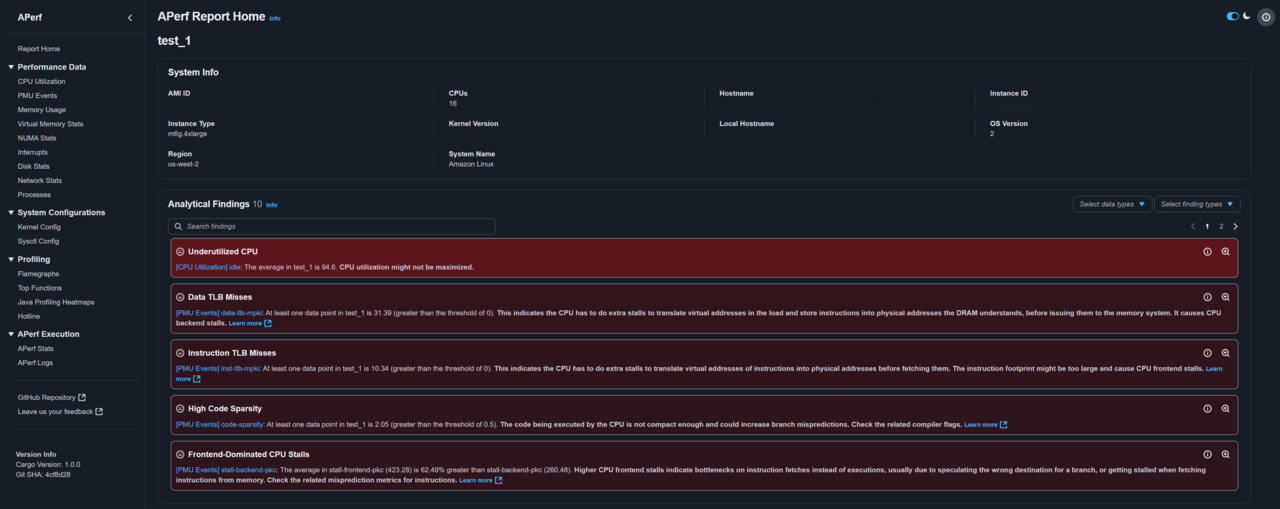
The report’s home page displays system information from the APerf run, followed by analytical findings that highlight potential performance issues:
 APerf report home page
You can browse through all collected data using the navigation panel on the left.
To learn more about a specific metric, select the info button next to it to open the help panel:
 APerf report help panel
Compare multiple runs
To demonstrate comparing multiple runs, create a second run with aperf record:
aperf record -r test_2
Similarly, after 10 seconds, the collection completes. APerf produces a directory named test_2 and a tar file named test_2.tar.gz.
Generate a report that includes both runs. The first run in the -r arguments becomes the base run for automatic comparisons:
aperf report -r test_1 test_2 -n compare_report
APerf creates a directory named compare_report and a tar file named compare_report.tar.gz.
Open the index.html file in the compare_report/ directory using a web browser.
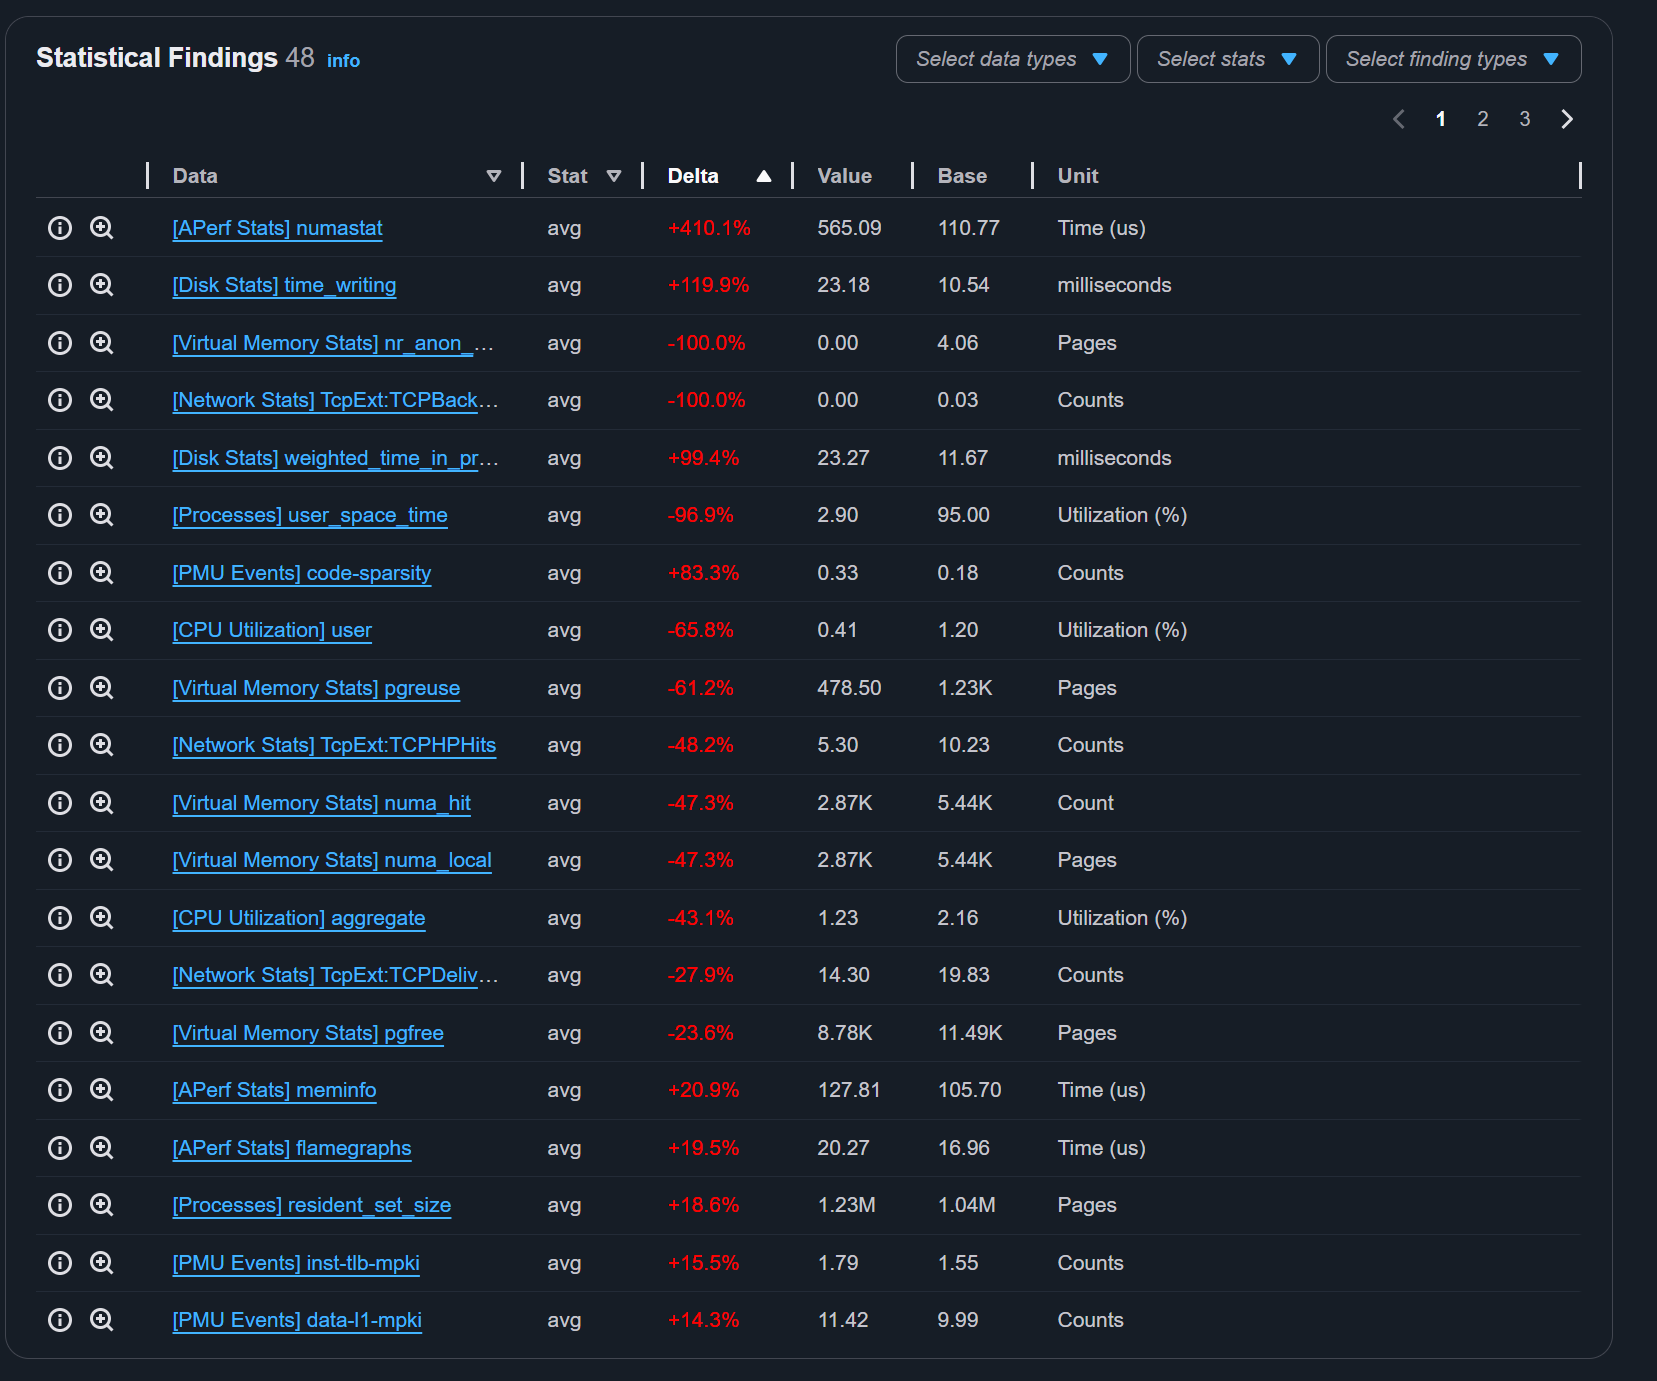
Because the report includes multiple runs, APerf compares all runs against the base run and displays statistical findings on the home page:
 APerf report statistical findings
When you view metric graphs, APerf aligns graphs of the same metric from different runs side by side for easy comparison:
 APerf report aligned graphs
View reports from a remote system
If you’re working on a remote system or cloud instance without a desktop environment, you can view APerf reports in your local browser by running a web server on the remote machine.
Navigate to the directory containing the report and the index.html file:
cd test_report
Start a simple HTTP server:
python -m http.server 3000
The server starts on port 3000. Make sure this port is open in your firewall or security group settings.
Open a web browser on your local machine and navigate to:
http://<remote-ip-address>:3000
Replace <remote-ip-address> with the IP address of your remote system.
The APerf report opens in your browser without needing to copy files to your local machine.
You’re now ready to use APerf for performance analysis on your Arm Linux system.
Give Feedback
How would you rate this tool quick-install guide?
What is the primary reason for your feedback ?
Thank you! We're grateful for your feedback.
- Have more feedback? Log an issue on GitHub.
- Want to collaborate? Join our Discord server.