Compare MobileNetV2 deployment results
After the individual benchmark runs, you will view the results together in the dashboard. This makes it easier to compare average latency, and run-to-run variation.
Run on the Raspberry Pi:
course_support/serve_results.py \
  --results ~/executorch_on_arm/module-2-cnn-inference-with-quantization/results \
  --host 127.0.0.1 \
  --port 8080
Open on the development machine:
http://localhost:8080
The summary shows the three MobileNetV2 runs side by side:
| Model | Runtime | Warmups | Runs | Mean (ms) | Median (ms) | Min (ms) | Max (ms) |
|---|---|---|---|---|---|---|---|
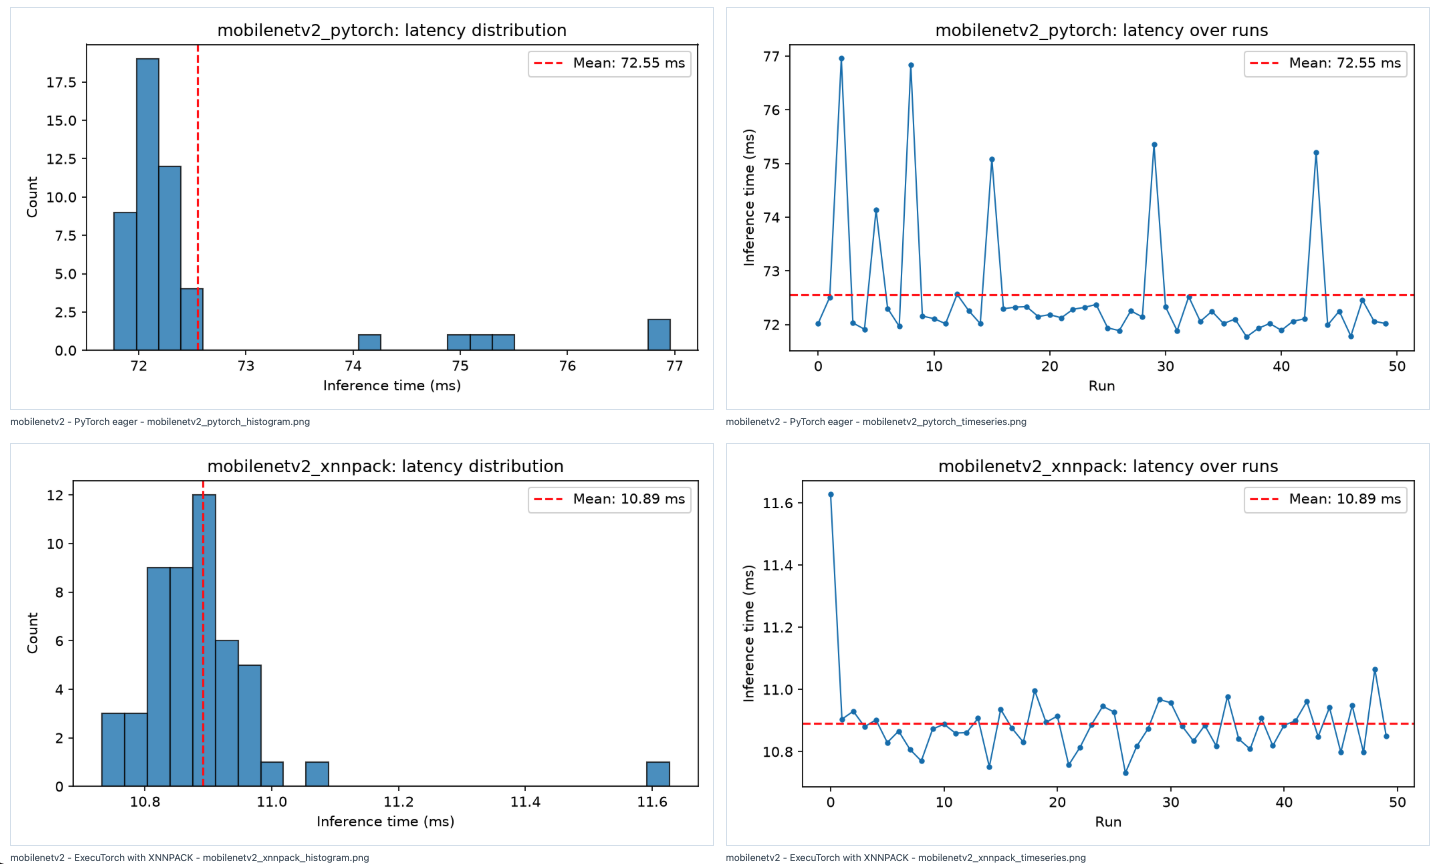
| mobilenetv2 | PyTorch eager | 10 | 50 | 72.55 | 72.15 | 71.77 | 76.96 |
| mobilenetv2 | ExecuTorch with XNNPACK | 10 | 50 | 10.89 | 10.88 | 10.73 | 11.63 |
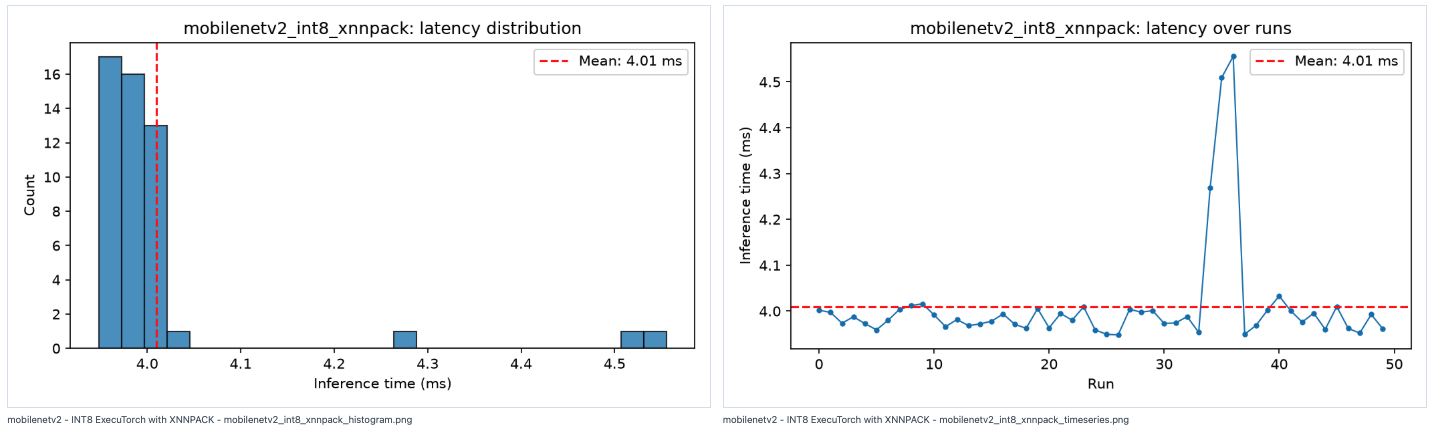
| mobilenetv2 | INT8 ExecuTorch with XNNPACK | 10 | 50 | 4.01 | 3.98 | 3.95 | 4.56 |
The PyTorch eager and FP32 ExecuTorch with XNNPACK plots show the latency distribution and run-to-run variation for the first two paths:
The INT8 plots show the quantized path:
Use the dashboard, artifact sizes, and top-5 output to answer:
| Question | Your conclusion |
|---|---|
| Which of the three runtime configurations best meets the latency and artifact-size requirements? | |
| Which measurements support that choice? | |
| Did the top-5 output remain useful after quantization? | |
| What accuracy or application testing is still required before production use? |
Course complete
Nice work
You completed Optimize and deploy AI inference with ExecuTorch on Arm.